. Farm financial record studies . tive livestock per acre ----- - - . Receipts from productive livestock per acre ------------- 1 297 119 1+21335-21+1 527.086.61 1 371II+2 72II+I+6.2 5572 7.267.80 1 225109 2I+ ll+U 6.8 U8 28 6.90 6.^1 Power and machinery cost per cropacre -------- - - Machinery cost per crop acre- - -Value of feed fed to horses - - - Man labor cost per $100 grossincome ------------- Man labor cost per acre - - - - - Expenses per $100 gross income-Farm improvements cost per acre Farms with tractor- ------ Excess of sales over cash expenses- jDecrease in inventory ------- j
Image details
Contributor:
Reading Room 2020 / Alamy Stock PhotoImage ID:
2CHMF9HFile size:
7.1 MB (279.5 KB Compressed download)Releases:
Model - no | Property - noDo I need a release?Dimensions:
1794 x 1393 px | 30.4 x 23.6 cm | 12 x 9.3 inches | 150dpiMore information:
This image is a public domain image, which means either that copyright has expired in the image or the copyright holder has waived their copyright. Alamy charges you a fee for access to the high resolution copy of the image.
This image could have imperfections as it’s either historical or reportage.
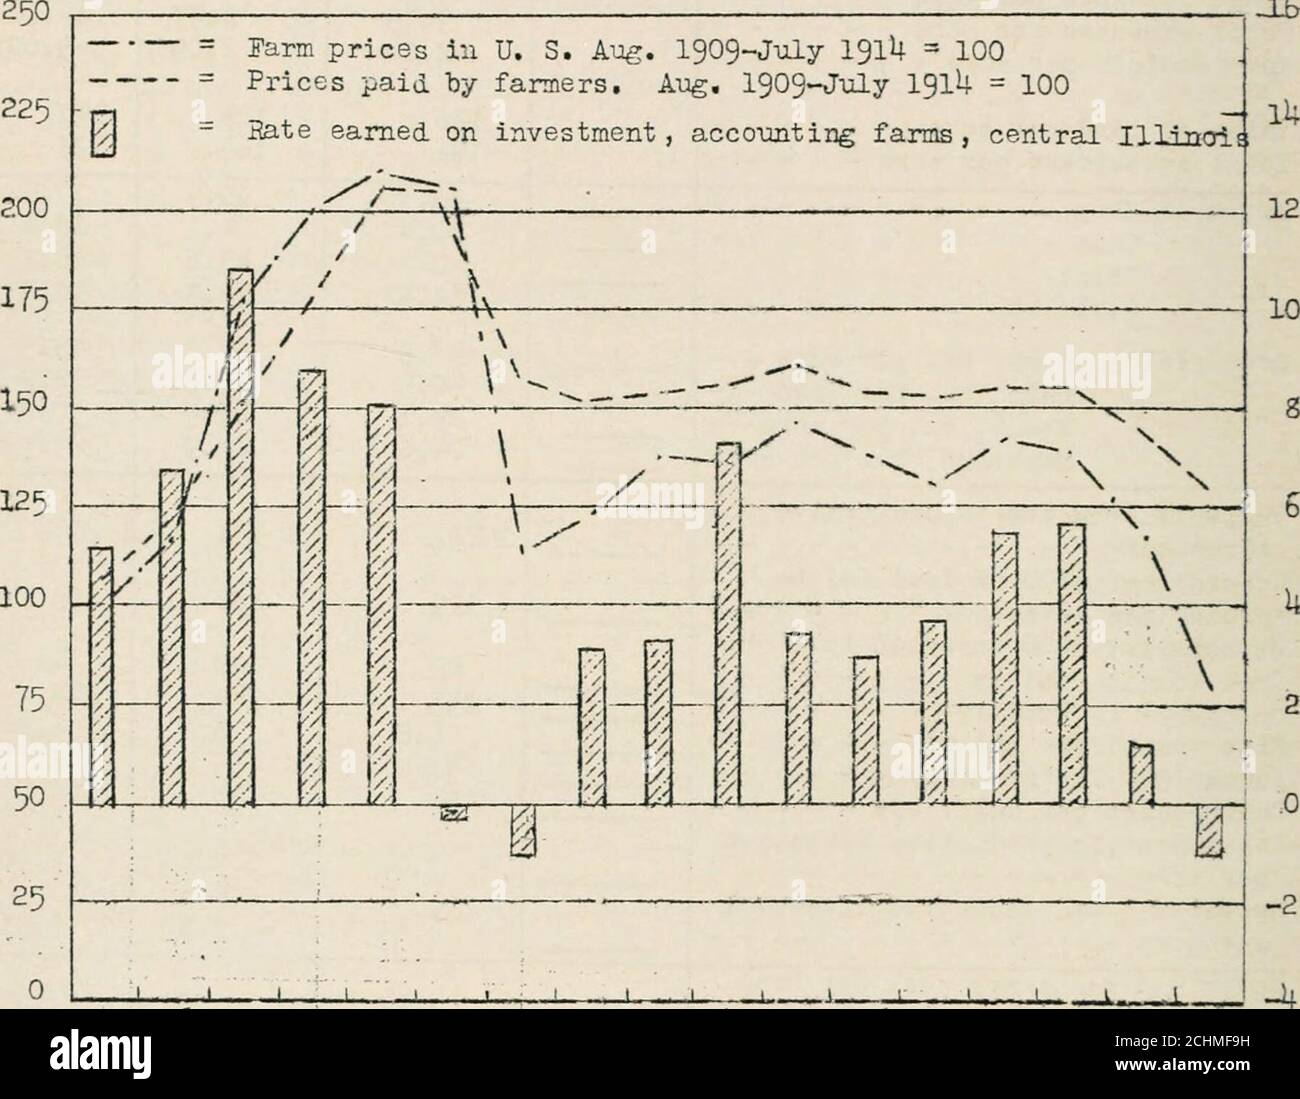
. Farm financial record studies . tive livestock per acre ----- -___-__. Receipts from productive livestock per acre ------------- 1 297 119 1+21335-21+1 527.086.61 1 371II+2 72II+I+6.2 5572 7.267.80 1 225109 2I+ ll+U 6.8 U8 28 6.90 6.^1 Power and machinery cost per cropacre --------_-_-__ Machinery cost per crop acre- - -Value of feed fed to horses - - - Man labor cost per $100 grossincome ------------- Man labor cost per acre - - - - - Expenses per $100 gross income-Farm improvements cost per acre Farms with tractor- ------ Excess of sales over cash expenses- jDecrease in inventory ------- j 3.1+22.16180 58U.U8 126 .7U 11 3361 071 2.821.5822I+ 1+0U.3I 80 U.1+5 2.9915I+ 785.07 .^5 186 73^^ 1 £l6 51+7 .95 9891 l+lU Farir. EprnJnKS and the G-ener-yl Piic£-Lcvel Records of Illinois farm earnings available since 1915 show thatfarm profits drop rapidly doring periods wlien the general price-level isdeclinins. This -.vas true for the years 1920 and 1921 and also for I93Oand 1931. (See graiih). Index of PricRs Rate earmsd. 1915 116.117 IS 20 21 22 »23 «2U »25 25 27 28 >29 30 131 INFLlIEiyCE OF PRICE CEAUGES ON PARI;! EAIg:iNGS 1915-19^1 Farm earnings reflect immediately changes in the farmerspurchasing power. The decline in the general price level whichstarted in I92O caused a wide spread to occur between the pricespaid by farmers for goods purchased and the prices received for farmproducts sold. This spread narrowed from I923 to I929 but widenedagain in I93O and 1931• The average rate earned on investment on rc-cotmt keeping farms in central 111inois-> which v-as S percent in I919, dropped to a loss of 1 percent in I92I ?nd recovered to an average ofabout k percent for the peri.od.l922 to 1929. When the price-levelwent down again in I93O, the rate earned on investment dropped toabout 1 percent and in 1931 the average Ior nceount-keeping farms tncentral Illinois indicated a loss of about 1 percent. -2SJ, - AimiAL JAM BUSXIJESS HKPORT OSF THIRTY IASliiS IS SG0TT