. The Cost of Policy Inaction: The case of not meeting the 2010 biodiversity target. services provided. The analysis above assumes that the two vary proportionately or with a maximum function (see Chapter 5), and this helps to explain a large proportion of the overall COPI estimates. Empirical evidence of the relationships is plentiful, but quantitative causal substantiation is scarce yet. Similarly it will be important to do a careful analysis of where relationships between the loss of habitat/landuse area and ecosystem service provision are linear (eg provision of wood) - the core operationa
Image details
Contributor:
The Book Worm / Alamy Stock PhotoImage ID:
RE77W9File size:
7.1 MB (188 KB Compressed download)Releases:
Model - no | Property - noDo I need a release?Dimensions:
1996 x 1251 px | 33.8 x 21.2 cm | 13.3 x 8.3 inches | 150dpiMore information:
This image is a public domain image, which means either that copyright has expired in the image or the copyright holder has waived their copyright. Alamy charges you a fee for access to the high resolution copy of the image.
This image could have imperfections as it’s either historical or reportage.
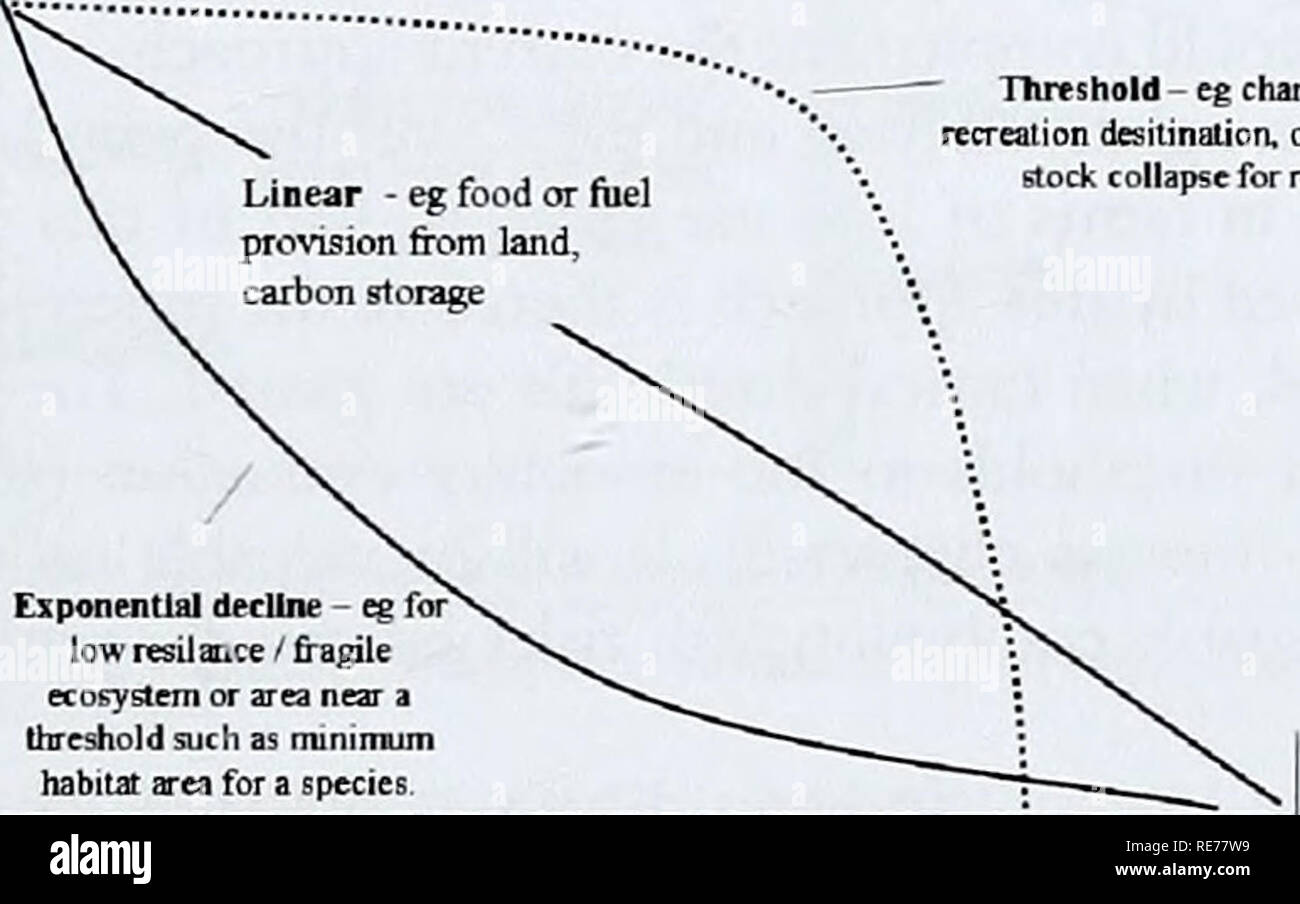
. The Cost of Policy Inaction: The case of not meeting the 2010 biodiversity target. services provided. The analysis above assumes that the two vary proportionately or with a maximum function (see Chapter 5), and this helps to explain a large proportion of the overall COPI estimates. Empirical evidence of the relationships is plentiful, but quantitative causal substantiation is scarce yet. Similarly it will be important to do a careful analysis of where relationships between the loss of habitat/landuse area and ecosystem service provision are linear (eg provision of wood) - the core operational assumption within the COPI study - and where they are less sensitive to loss (eg in initial phases of forest loss of a large forest for tourism), where they are very sensitive (eg ecologically poor or fragile areas) and where there are non linearities or critical thresholds (eg level at which species populations cannot be maintained) is important (see Figure 6.7 for simplified schematic). The possibility and limitations of substitution and how this should be integrated into analysis are also important issues to explore further. Relation of Habitat Area, its loss & Ecosystem Service I nl! In Hi Insensitive (eg loss of pail of large forest and tourism or recreation) or due to stow draw down of slock (eg fish) or due to initial substitution possibilities — Threshold-eg change of recreation designation, offish stock collapse for region. Exponential decline - eg low resil aiice / fragile ecosystem or area near a threshold such as minimum habitat area for a species Pristine Area loss * Full area loss Figure 6.7 Relationship between changes in habitat area and change in ecosystem sen ices There is also a range of different ways of arriving at the cost estimate, which can also influence the result. For example in some cases non-market estimates are very low (e.g. for recreation) compared to understanding of the scale of the market. A theoretically correct way may not lead to go