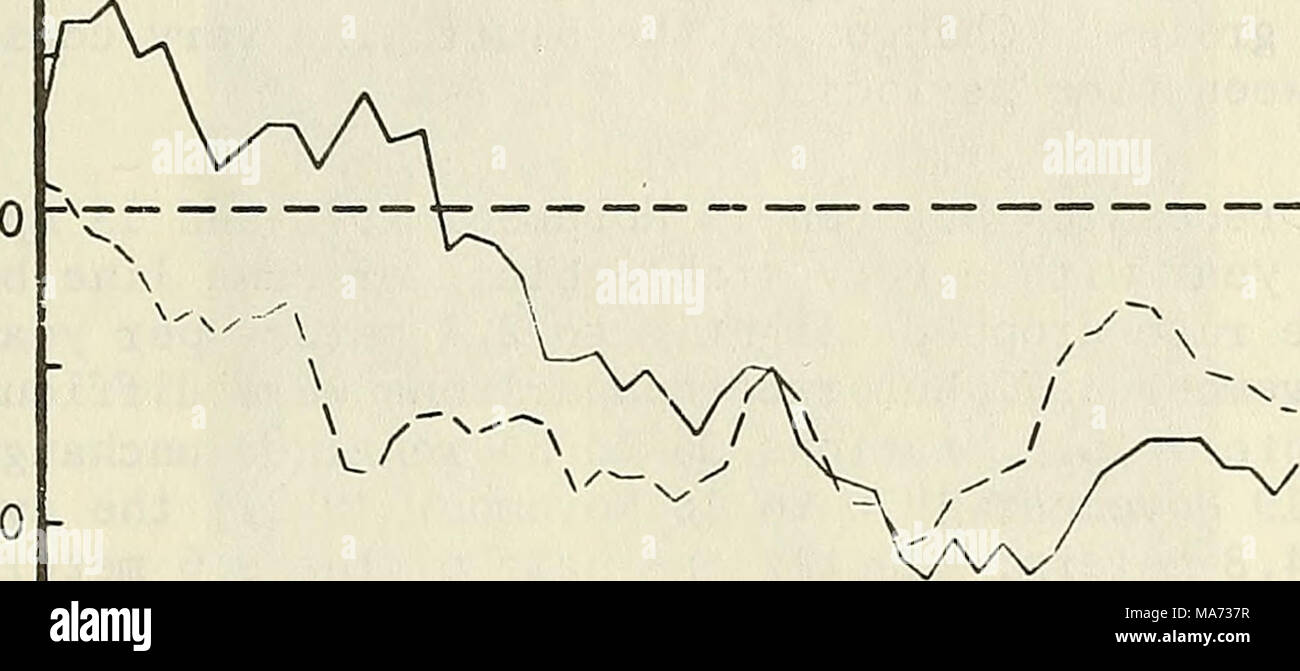
. The effect of structures and lake level on bluff and shore erosion in Berrien County, Michigan, 1970-74 . Bluff Recession Shoreline Chonges '''!'â â ''''' - 4 2 0 --2 - --4 ^ 6 -8 -10 10 20 30 Station 40 50 60 Figure 24. Rates of bluff recession and shoreline change alon| reach C from 15 April 1971 to 23 November 1974. Table 7. Summary of bluff shore, and beach data for re ach C (5 1 stations). Dat e lUuff recession Shorel ine change | Beach width' | Period length Rate 0 Max. Kate 0 Max. 0 Change Cm) (m/yr) (m/yr) (m/yr) (m) (m/yr) (m/yr) (m/yr) (m) (m) (ra) (mo) 15 Apr. 1971 13.3 9.2 1.5 2.
Image details
Contributor:
The Bookworm Collection / Alamy Stock PhotoImage ID:
MA737RFile size:
14.3 MB (276.2 KB Compressed download)Releases:
Model - no | Property - noDo I need a release?Dimensions:
3343 x 1495 px | 28.3 x 12.7 cm | 11.1 x 5 inches | 300dpiMore information:
This image is a public domain image, which means either that copyright has expired in the image or the copyright holder has waived their copyright. Alamy charges you a fee for access to the high resolution copy of the image.
This image could have imperfections as it’s either historical or reportage.
. The effect of structures and lake level on bluff and shore erosion in Berrien County, Michigan, 1970-74 . Bluff Recession Shoreline Chonges '''!'â â ''''' - 4 2 0 --2 - --4 ^ 6 -8 -10 10 20 30 Station 40 50 60 Figure 24. Rates of bluff recession and shoreline change alon| reach C from 15 April 1971 to 23 November 1974. Table 7. Summary of bluff shore, and beach data for re ach C (5 1 stations). Dat e lUuff recession Shorel ine change | Beach width' | Period length Rate 0 Max. Kate 0 Max. 0 Change Cm) (m/yr) (m/yr) (m/yr) (m) (m/yr) (m/yr) (m/yr) (m) (m) (ra) (mo) 15 Apr. 1971 13.3 9.2 1.5 2.2 .1.9 12.3 -2.1 -3.1 13.0 31.4 8 22 Dec. 1971 5.9 6.6 -7.4 3.3 3.6 4.0 15.0 -7.3 -8.0 6.9 -26.3 11 16 Nov. 1972 5.6 4.1 -0.3 1.6 1.7 6.7 11.6 -5.7 -6.3 3.6 -13.0 11 18 Oct. 1973 4.5 2.5 -1.1 2.2 2.0 i.4 7.0 2.0 1.? 3.7 9.5 13 23 Nov. 1974 6.6 2.3 2.1 15 Apr. 1971 to 8.5 2.4 3.5 7.2 -13.1 -3.7 1.7 -6.6 43 23 Nov. 1974 ^Beach width adjusted to lace level (176.79 meters IGLD). 5. Reach D. Reach D is located 3.0 kilometers south of the powerplant, inside the area affected by the beach nourishment project. The reach, which includes 39