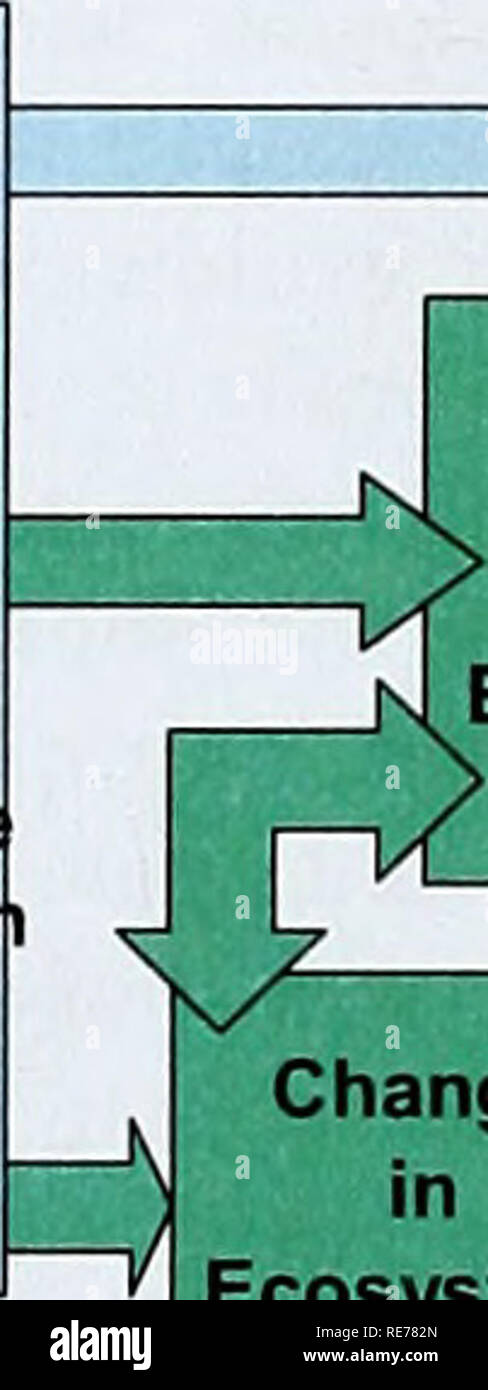
. The Cost of Policy Inaction: The case of not meeting the 2010 biodiversity target. Change in agriculture forestry built up land infrastructure JJ frag mentation Climate |/N-deposition. Change in Biodiversity I o Change in Ecosystem functions ^ Change In Ecosystem Services Change in Economic Value Figure 4.1 Chapter 4 in the conceptual model of the COPl-analysis The information presented in the global assessments of the past decade, e.g. Global Environment Oudook-3 (2002) and GEO-4 (2007), die Millennium Ecosystem Assessment (MA, 2005a), the Global Biodiversity Oudook 2 (CBD, 2006; Ten Brink

Image details
Contributor:
The Book Worm / Alamy Stock PhotoImage ID:
RE782NFile size:
7.2 MB (171.4 KB Compressed download)Releases:
Model - no | Property - noDo I need a release?Dimensions:
969 x 2580 px | 8.2 x 21.8 cm | 3.2 x 8.6 inches | 300dpiMore information:
This image is a public domain image, which means either that copyright has expired in the image or the copyright holder has waived their copyright. Alamy charges you a fee for access to the high resolution copy of the image.
This image could have imperfections as it’s either historical or reportage.
. The Cost of Policy Inaction: The case of not meeting the 2010 biodiversity target. Change in agriculture forestry built up land infrastructure JJ frag mentation Climate |/N-deposition. Change in Biodiversity I o Change in Ecosystem functions ^ Change In Ecosystem Services Change in Economic Value Figure 4.1 Chapter 4 in the conceptual model of the COPl-analysis The information presented in the global assessments of the past decade, e.g. Global Environment Oudook-3 (2002) and GEO-4 (2007), die Millennium Ecosystem Assessment (MA, 2005a), the Global Biodiversity Oudook 2 (CBD, 2006; Ten Brink et al., 2007) and the OECD Environmental Oudook (2008), has made clear that the rates of loss of biodiversity have accelerated dramatically over the past century. Current rates of species extinction are at least 2 orders of magnitude above background rates and are expected to rise to at least 3 orders above background rates while 20% of all species in those groups that have been comprehensively assessed are believed to be threatened with extinction in the near future (MA, 2005b). Even among species not threatened with extinction, the past 20-40 years have seen substantial declines in population size or the extent of range in most groups monitored. Rates of biodiversity decline vary. Some species and species groups are more vulnerable to change than others. Some generalist species are expanding their ranges, either naturally or as invasive aliens, whereas many ecological specialists are in decline. The drivers of loss are changing: invasive species and overexploitation were the predominant causes in historic times, while habitat conversion, especially from natural systems to agricultural use, is the most significant driver currendy. Climate change is expected to develop into a major threat in the near future. Interactions within ecological communities mean that changes in the abundance of one species will often have effects through the community. It is also quite clear that eco